How Clarity Reports works
A 5-minute tour of every page, what it does, and how to use it day to day.
The big picture
Every day at 4:30am IST, the system fetches Microsoft Clarity data for each website you've added. Claude reads that data and writes a daily report (a digest) for each property group. The bullet-point problems inside that digest become persistent issues in a backlog. You triage those issues from the home page until each one is resolved or marked won't-fix.
Clarity API → Claude writes → Issues extracted → You triage on
+ sessions a digest (one per problem) Triage page
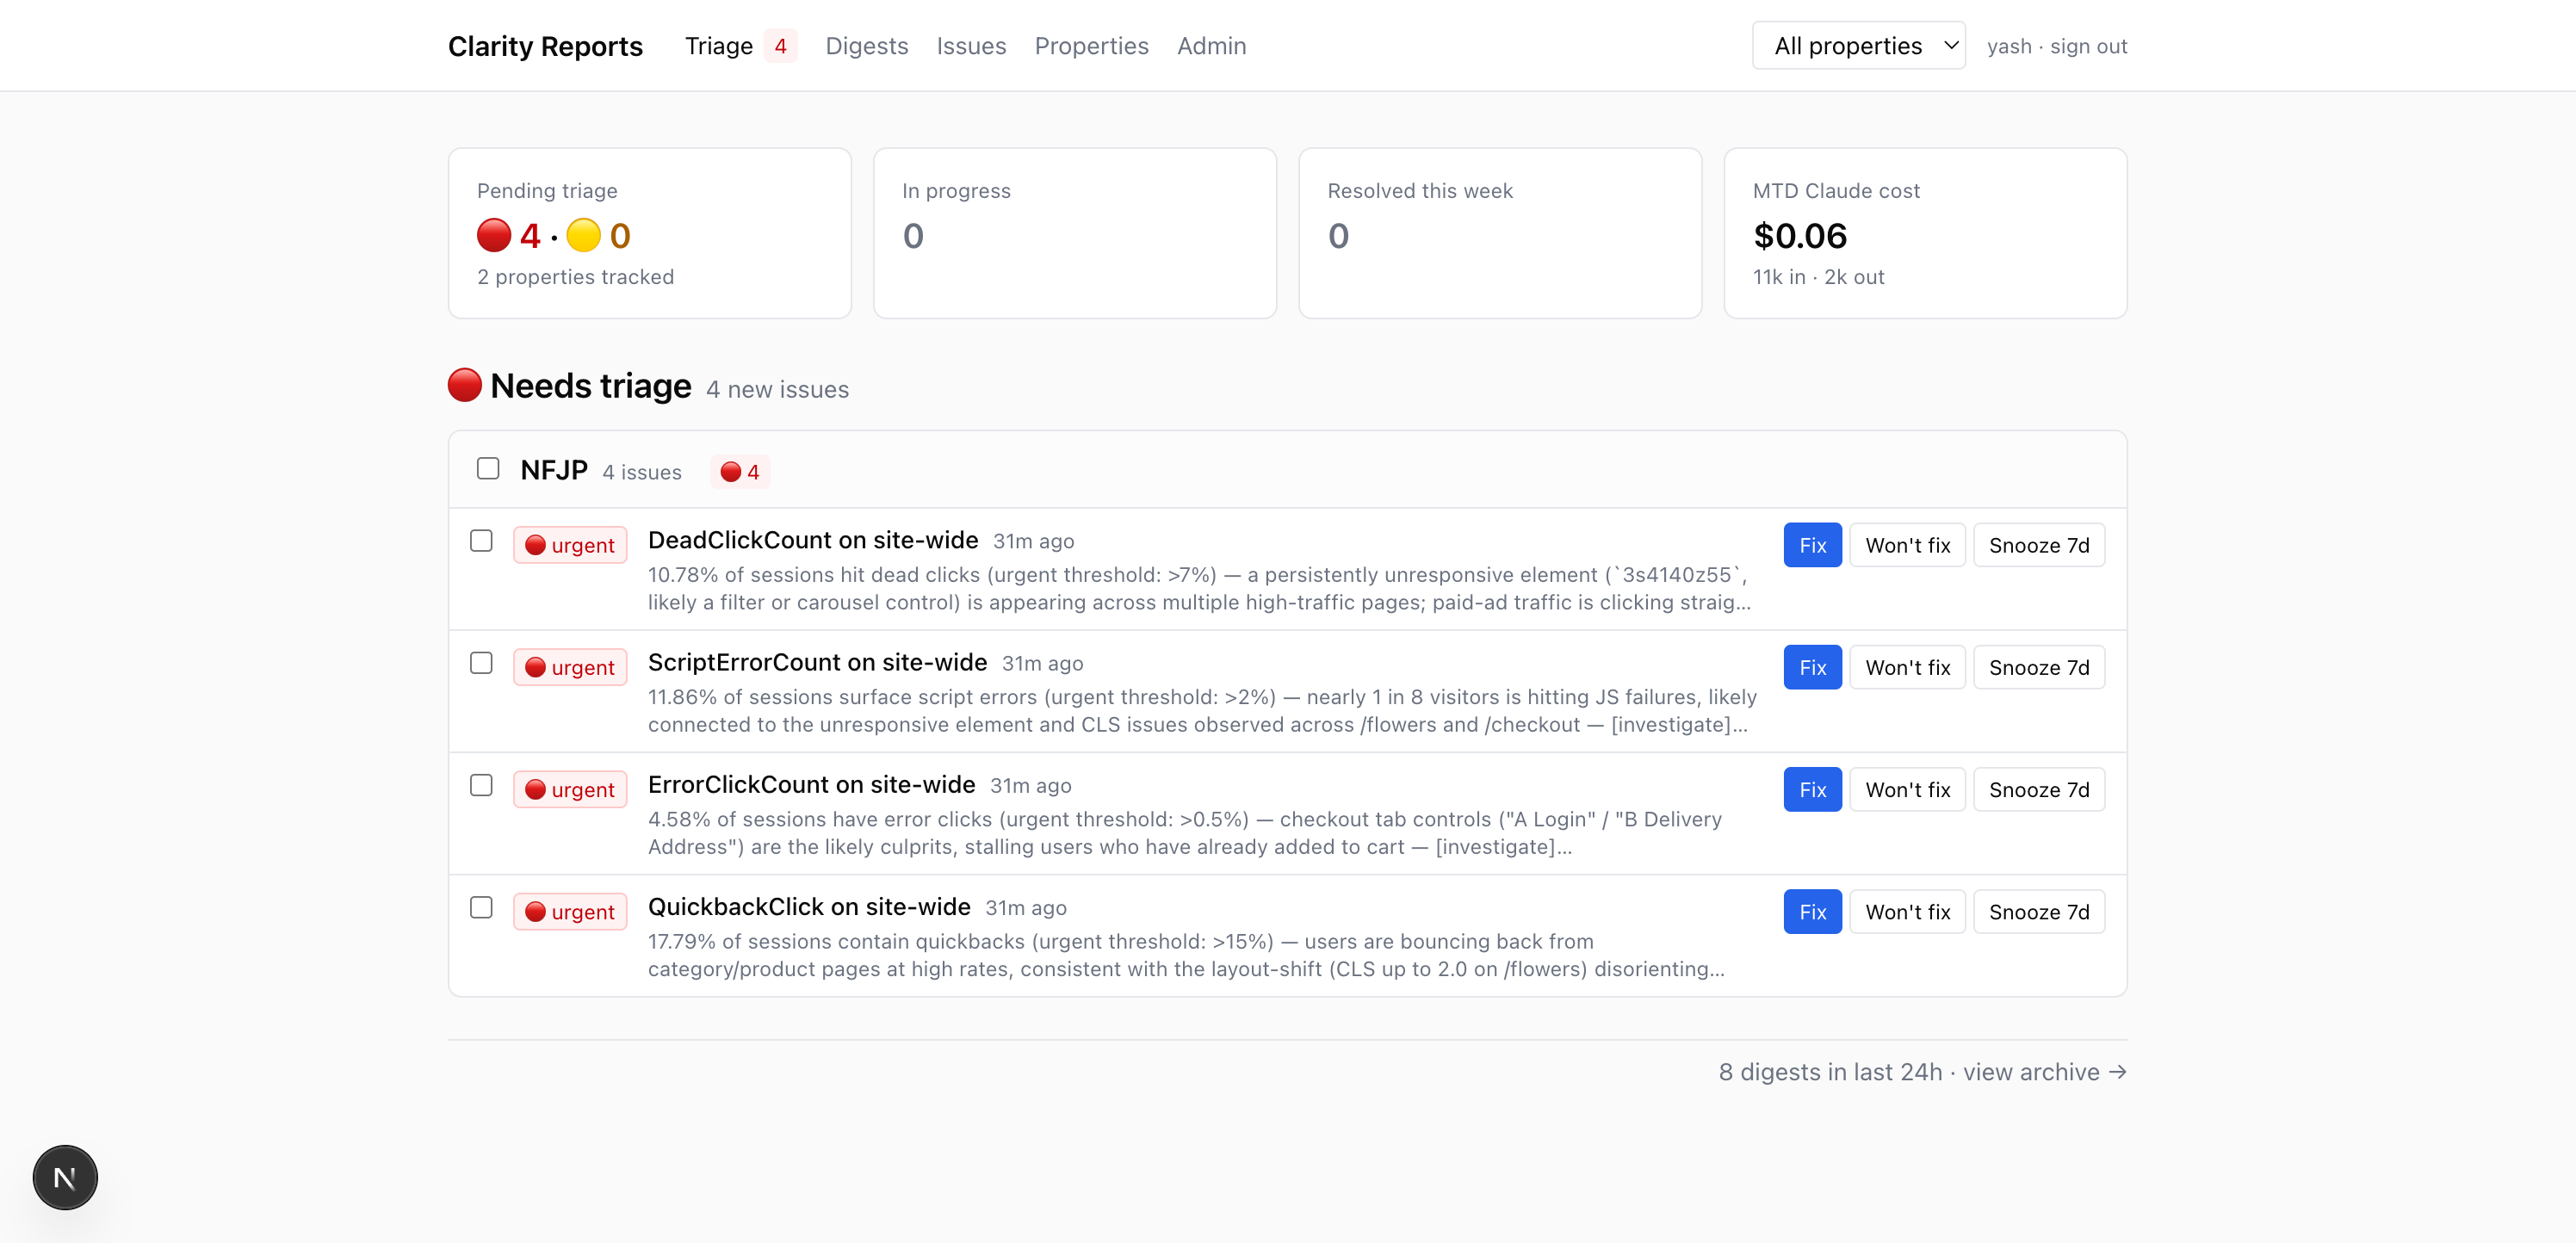
(per group) & deduped daily (this is the home page)Triage — your home page
/ answers one question: “what needs my attention right now?” It shows only OPEN and IN-PROGRESS issues, grouped by website. Resolved issues fall off; new ones land here.
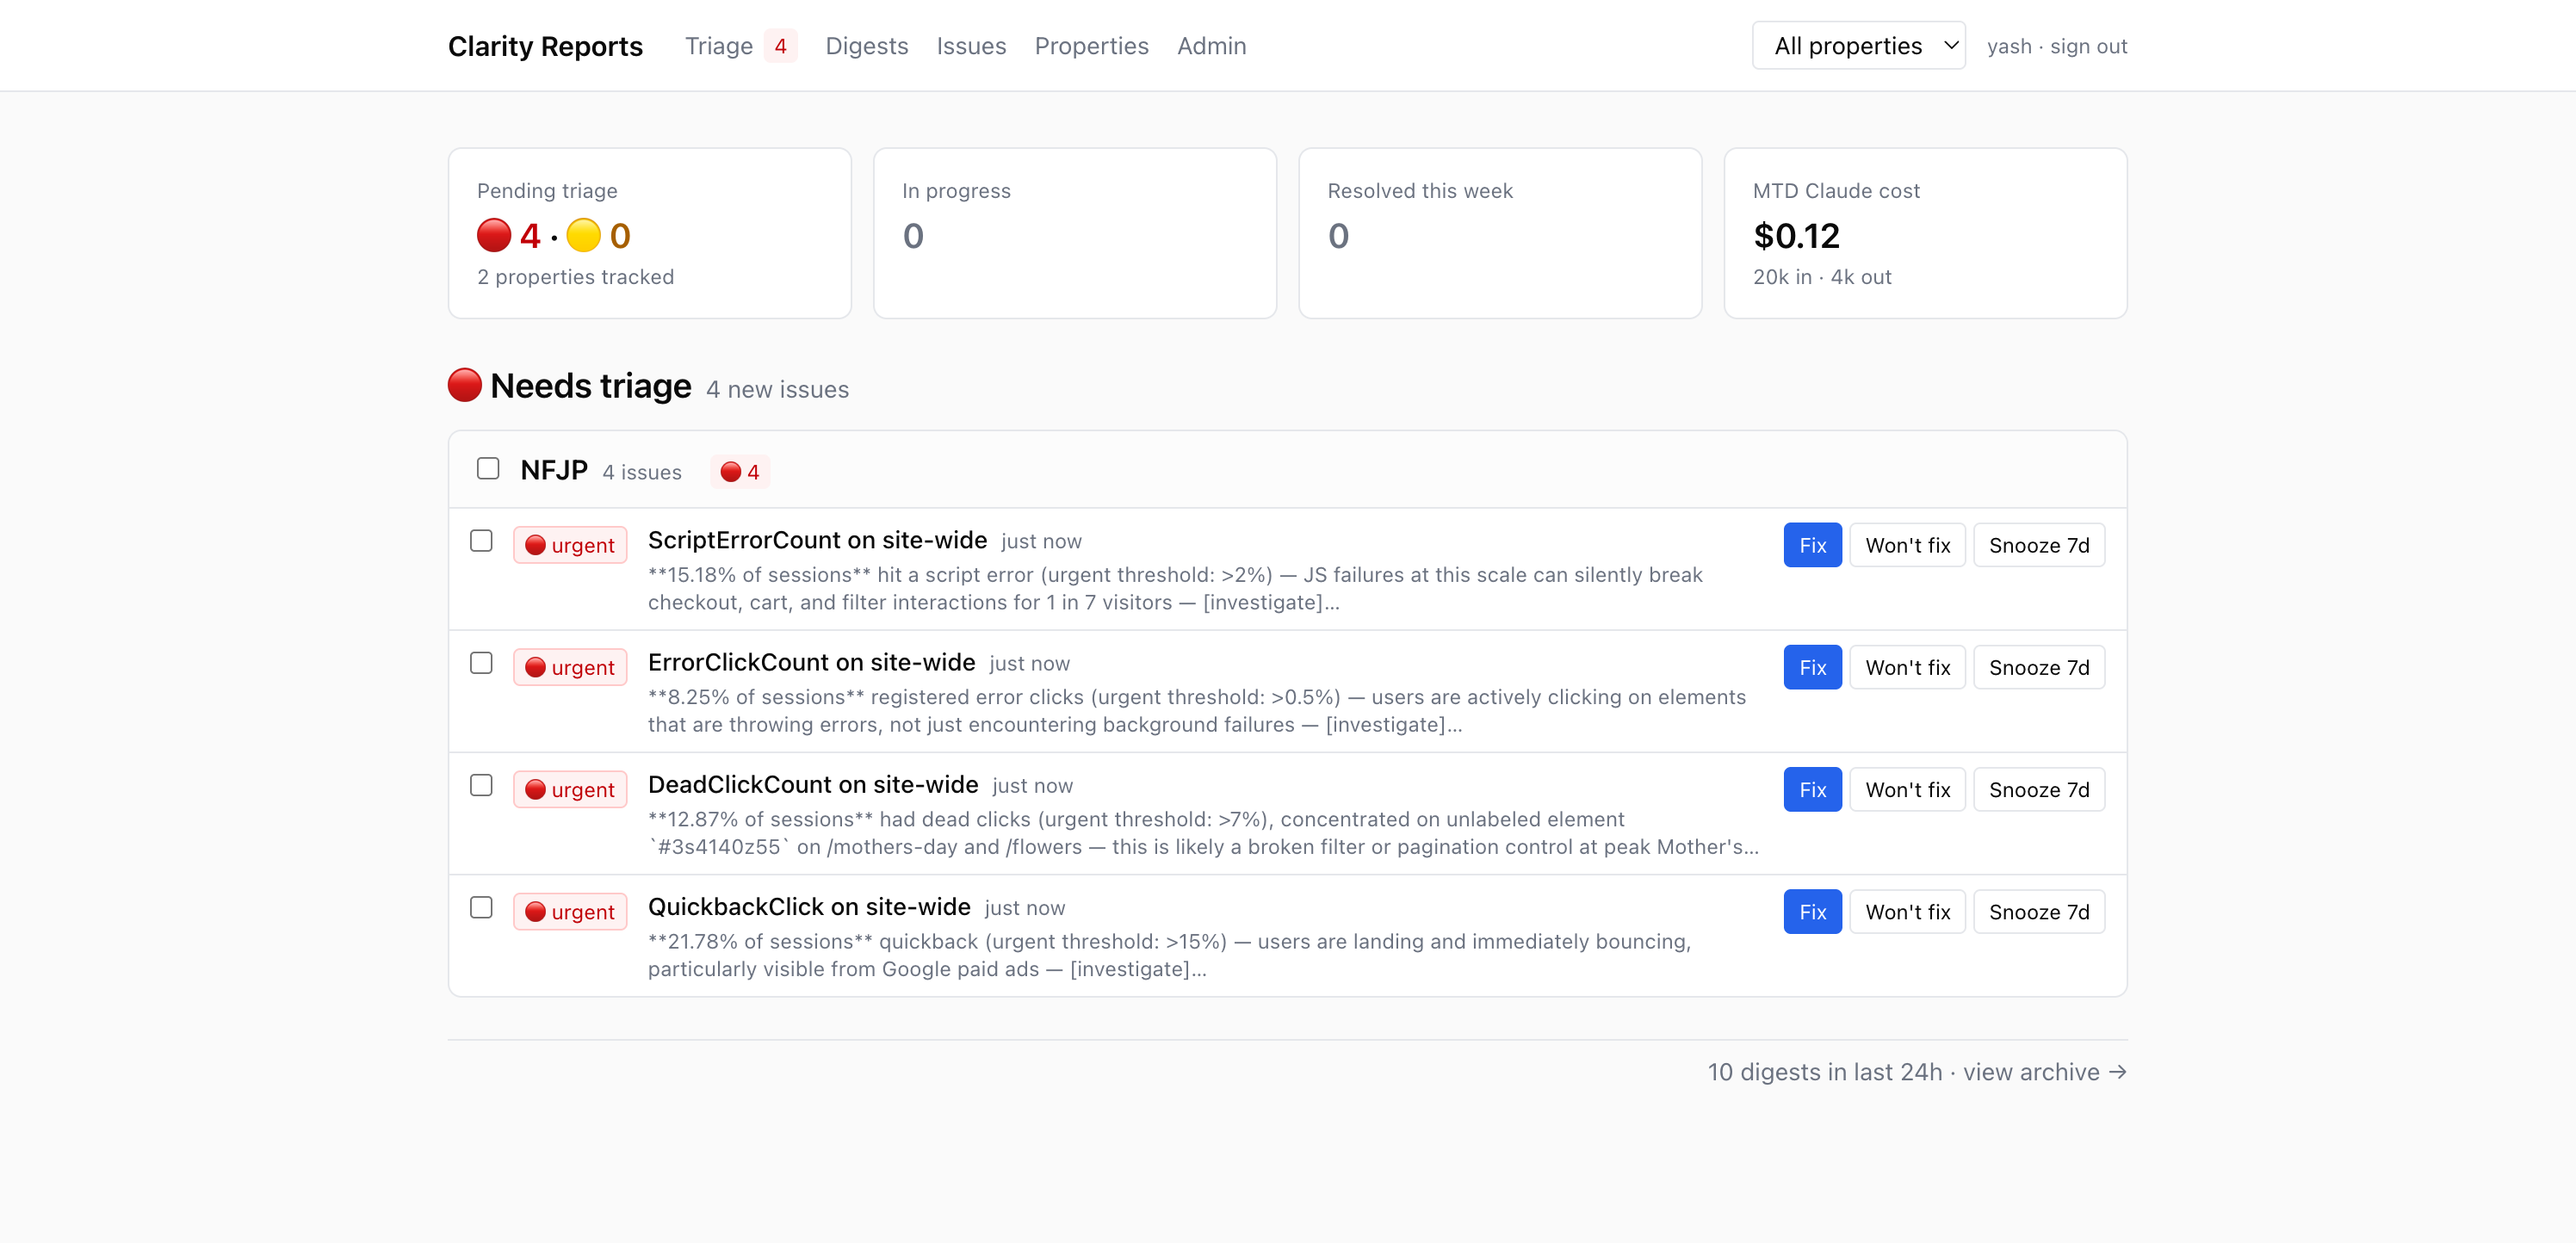
Acting on an issue
Each row has three buttons:
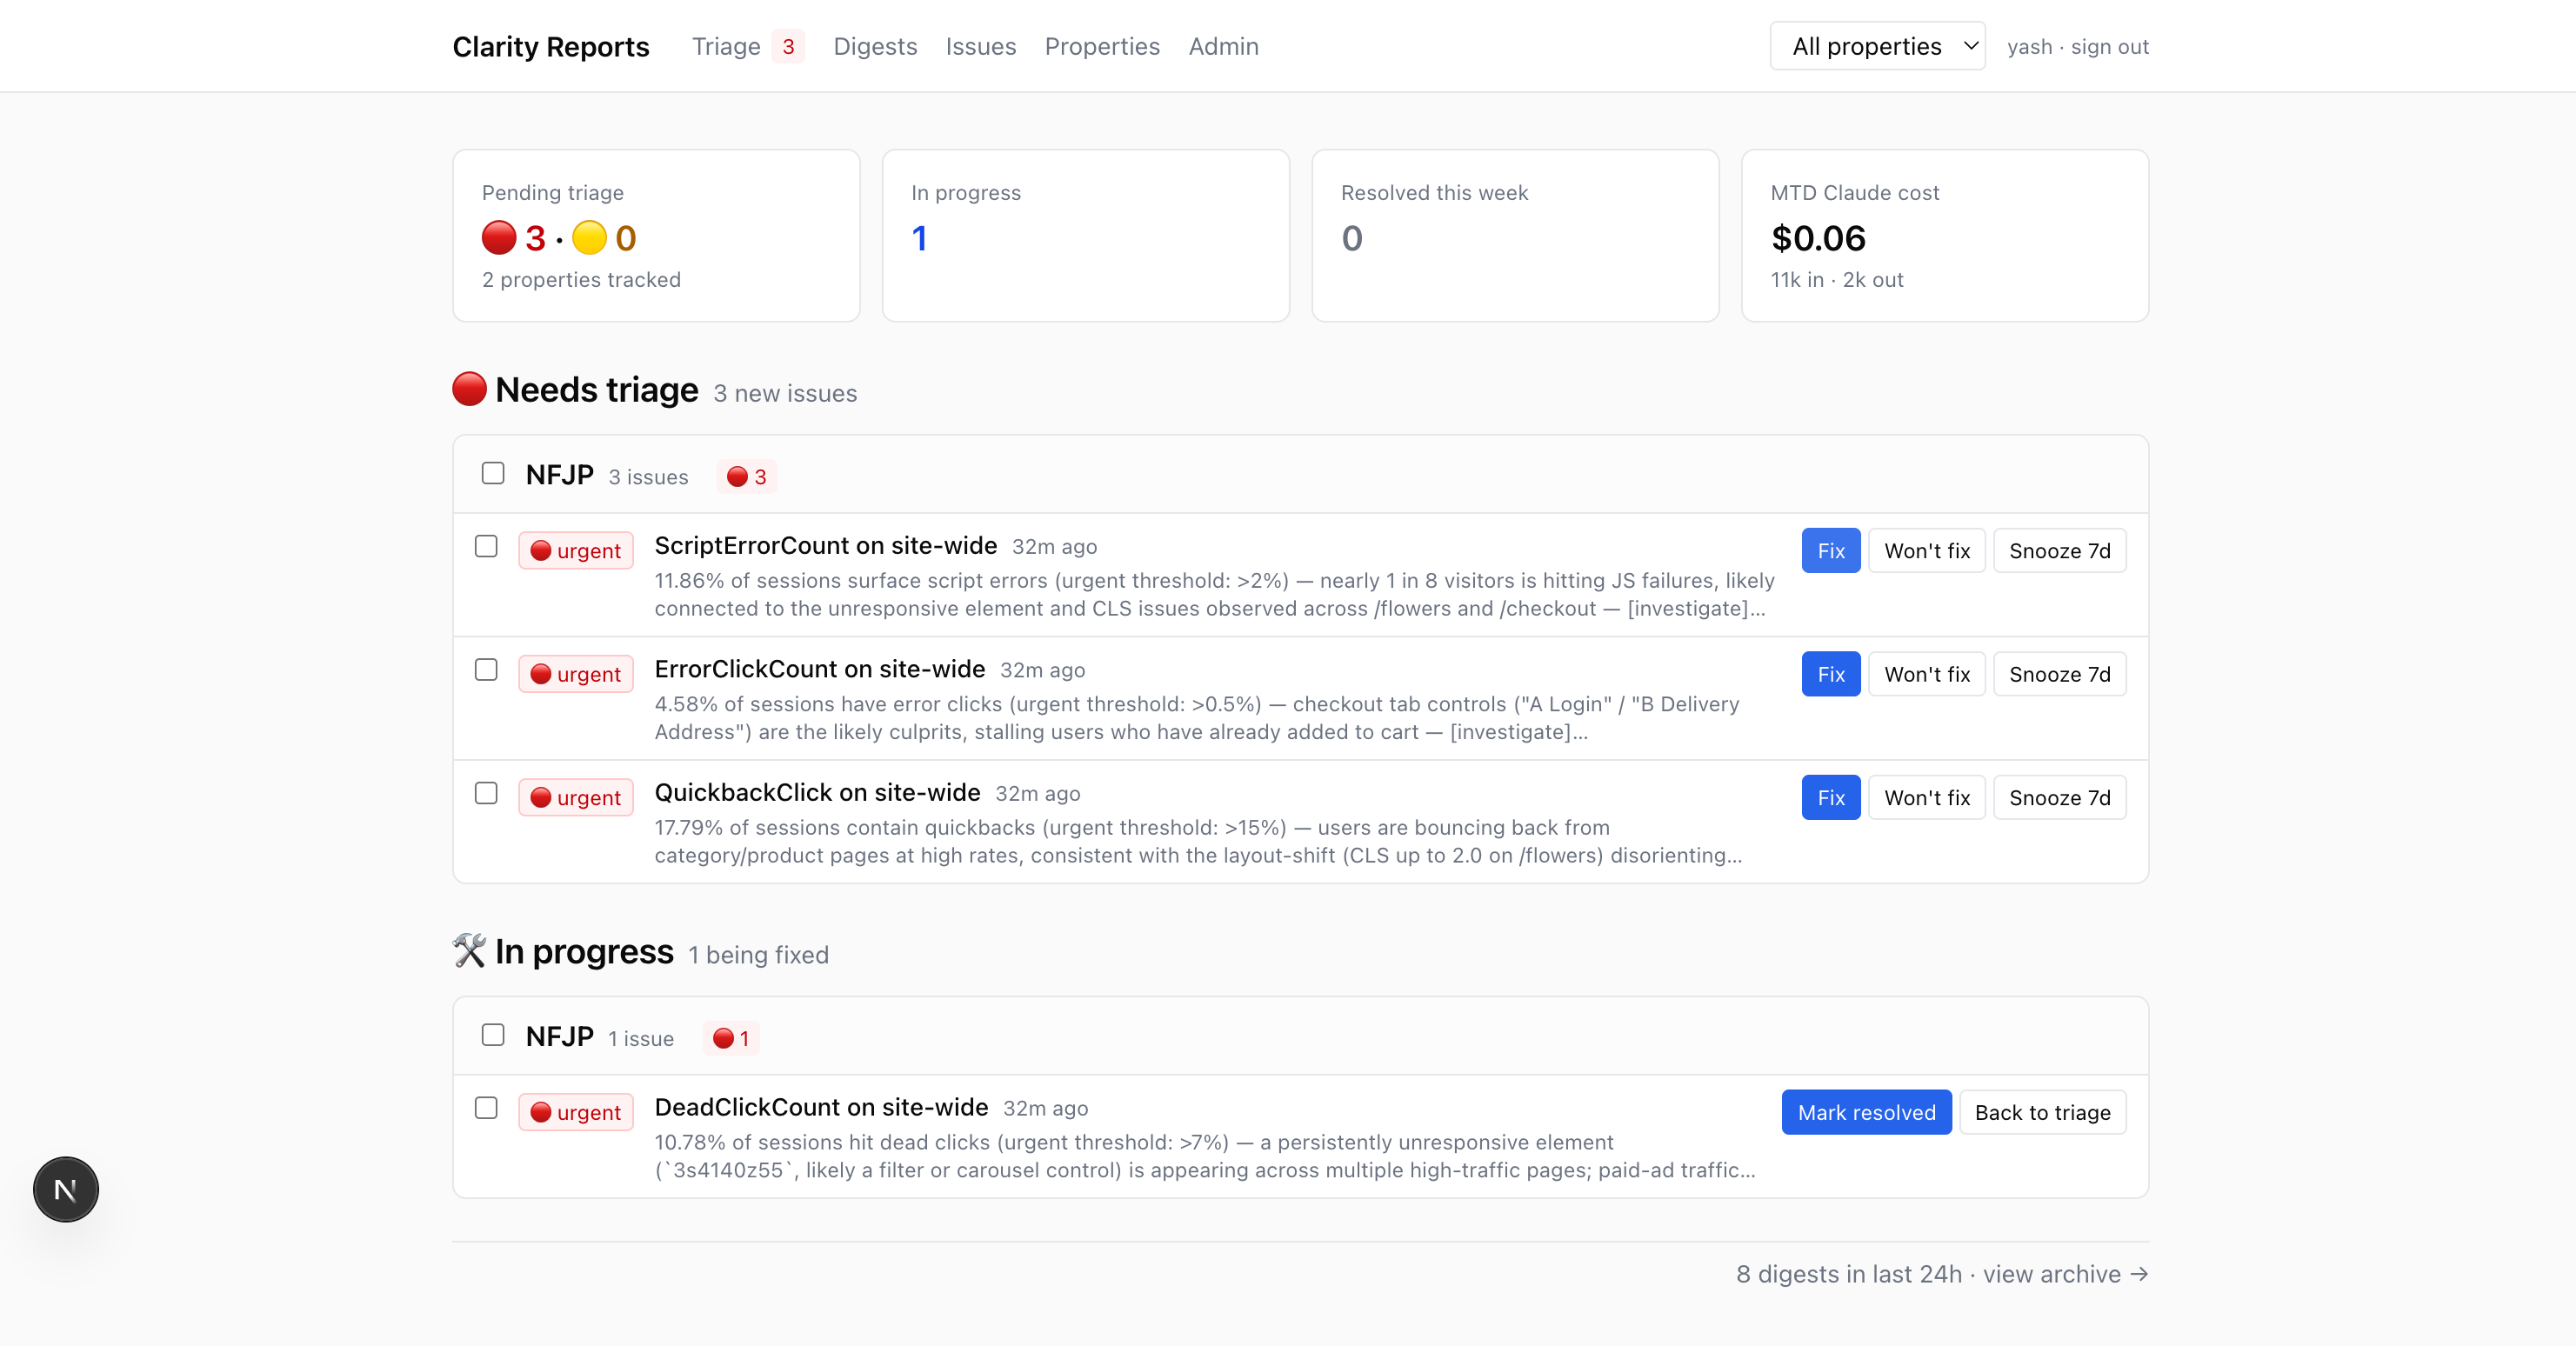
- Fix — “the team is going to work on this.” Moves it to the In progress section.
- Won't fix — “we've decided not to address this.” Removes it from triage.
- Snooze 7d — “come back to me in a week.” Hides it from triage until then.
You can also tick checkboxes on multiple issues to apply the same action in bulk.
Click any issue for details
Clicking the issue title opens a detail page with: an at-a-glance summary, a Claude-generated Suggested fix (most likely cause / what to check first / likely fix / how to verify), related session recordings, and the full technical body. Engineers and AI agents have everything they need to act.
Issues — the full backlog
/issues is a flat, searchable, filterable table of every issue ever flagged — open, fixing, snoozed, resolved, won't-fix. Use this when you want history, audit trail, or to find a specific issue.
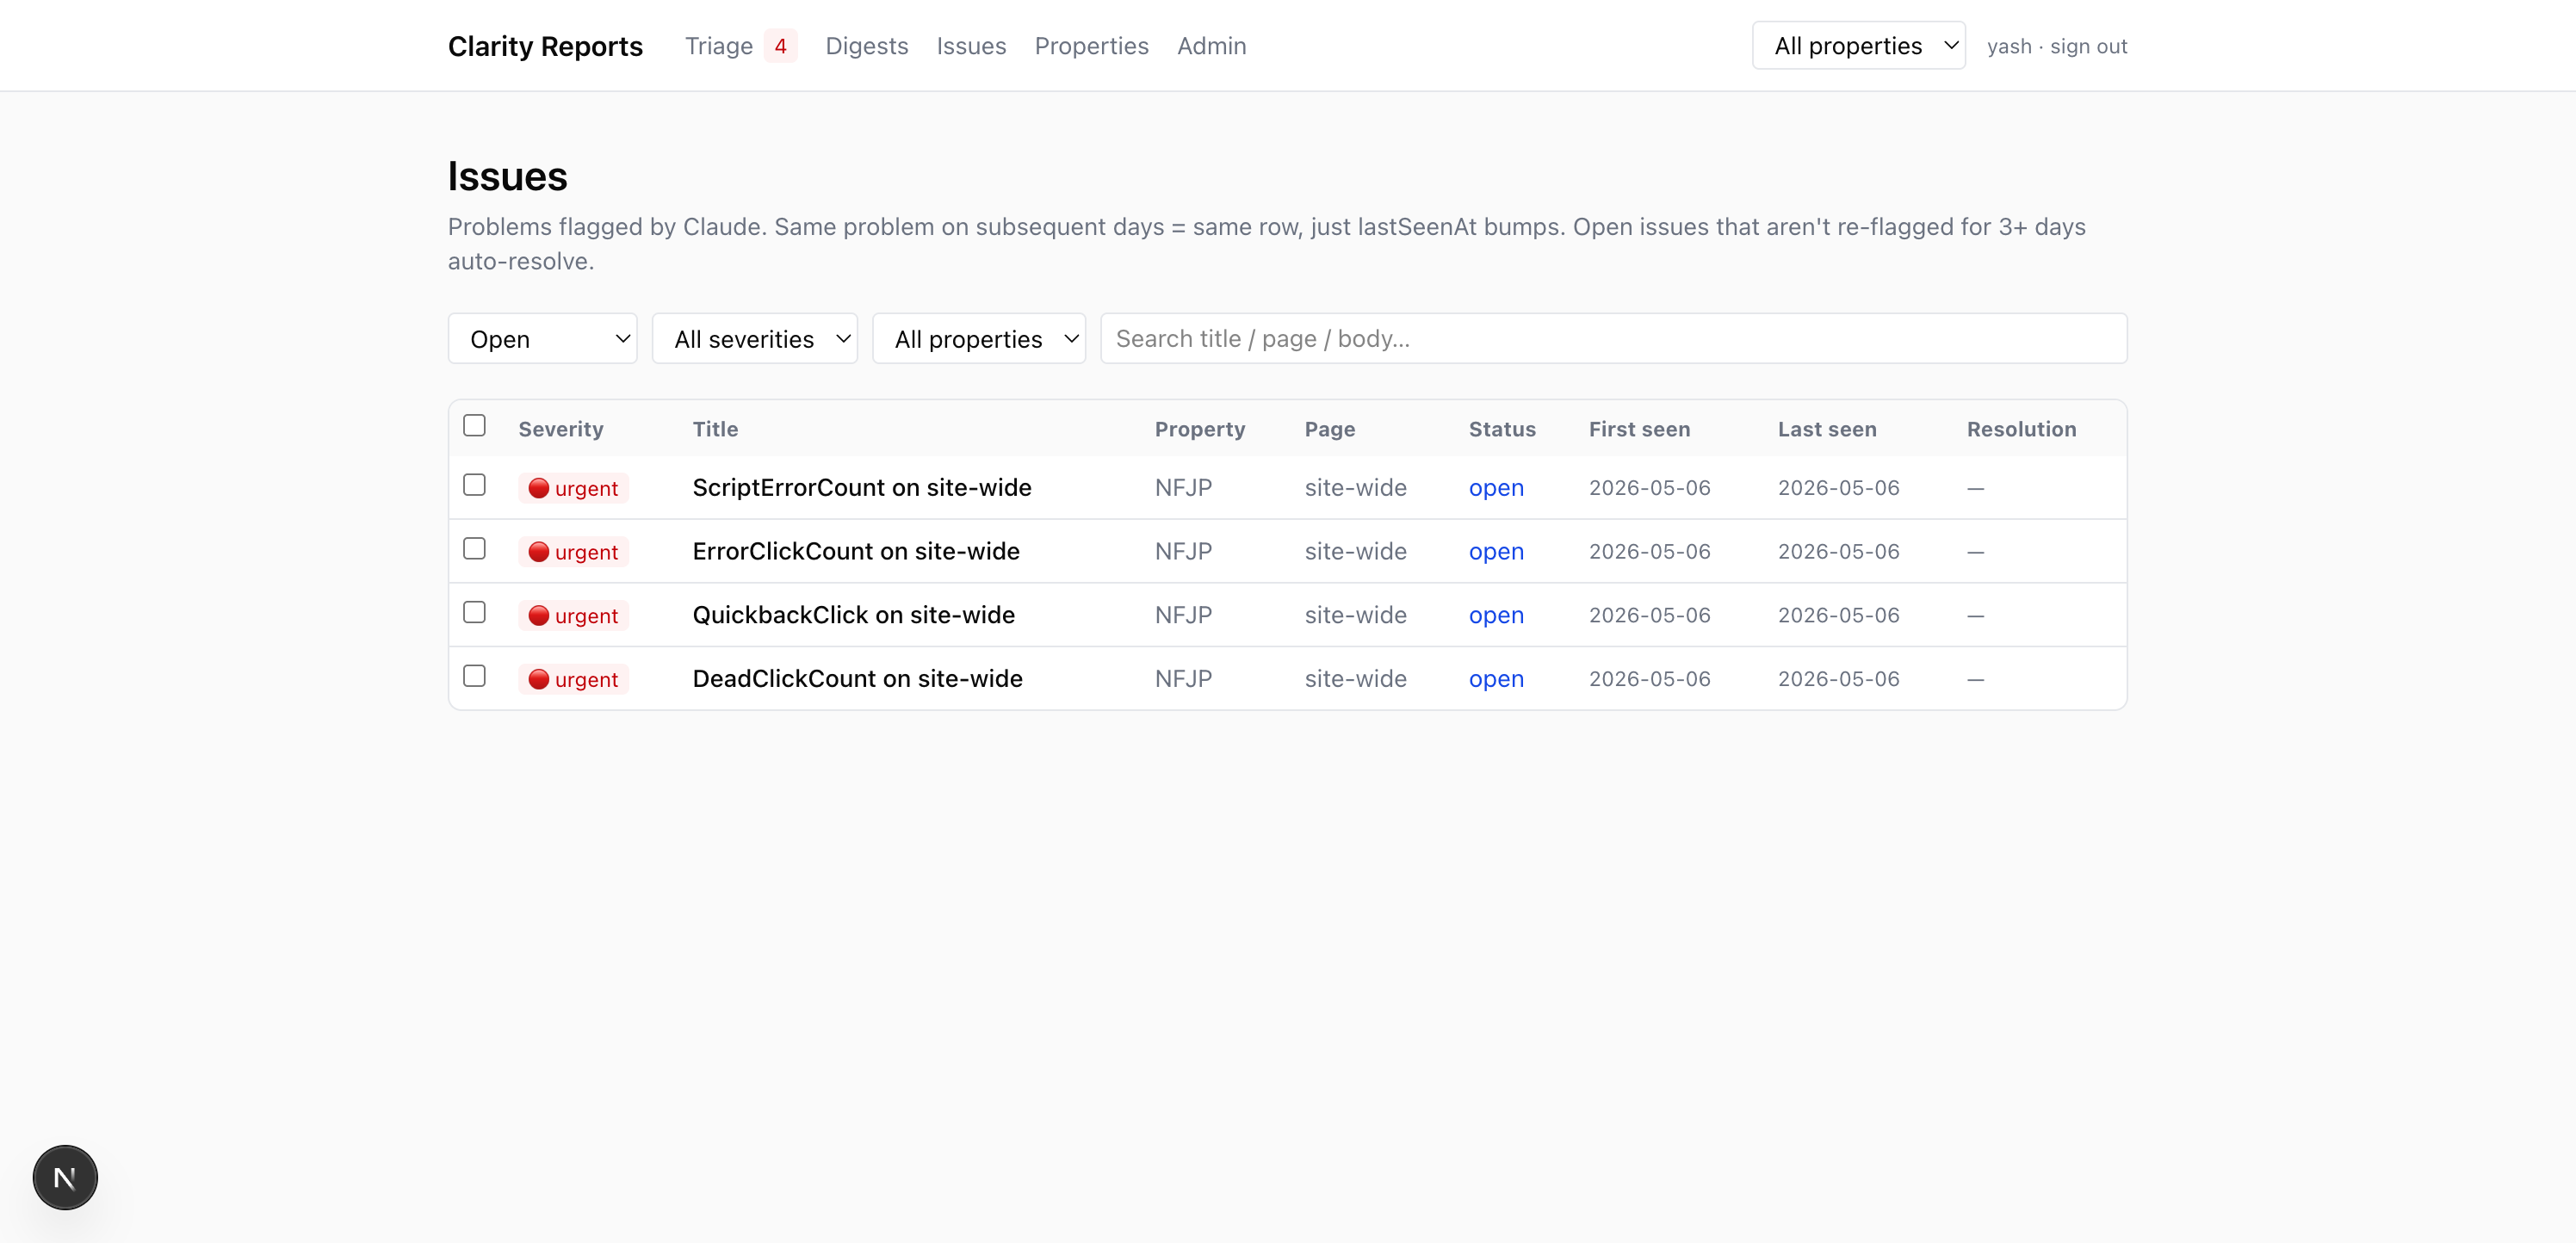
Same problem tomorrow ≠ duplicate row
When the next day's digest mentions the same problem on the same site, we don't create a new issue — we bump the existing row's “last seen” date. So your backlog stays sane even when a problem persists for weeks.
Resolving one issue closes its siblings
When you mark an issue resolved with a note like “fixed the carousel script,” we automatically close other open issues on the same site for the same metric (e.g. dead clicks across multiple pages likely share a root cause). Each auto-closed issue keeps a reference to the one you resolved, so you can review and reopen if you disagree.
Digests — what Claude wrote
/digests is the archive of Claude's daily reports. Each digest covers one property group's worth of sites, with a per-site narrative: TL;DR, top issues, sessions worth watching, traffic context.
You typically don't need to read digests — the issues extracted from them already show on Triage. But the archive is useful for: long-form context (what changed week over week), the per-session deep-dives, or when an issue refers to something you want to see in its original context.
Properties — drill into one website
/properties lists every Clarity project the team tracks. Click any property to open its detail page — that's where you go when you want to see everything about one site in one place.
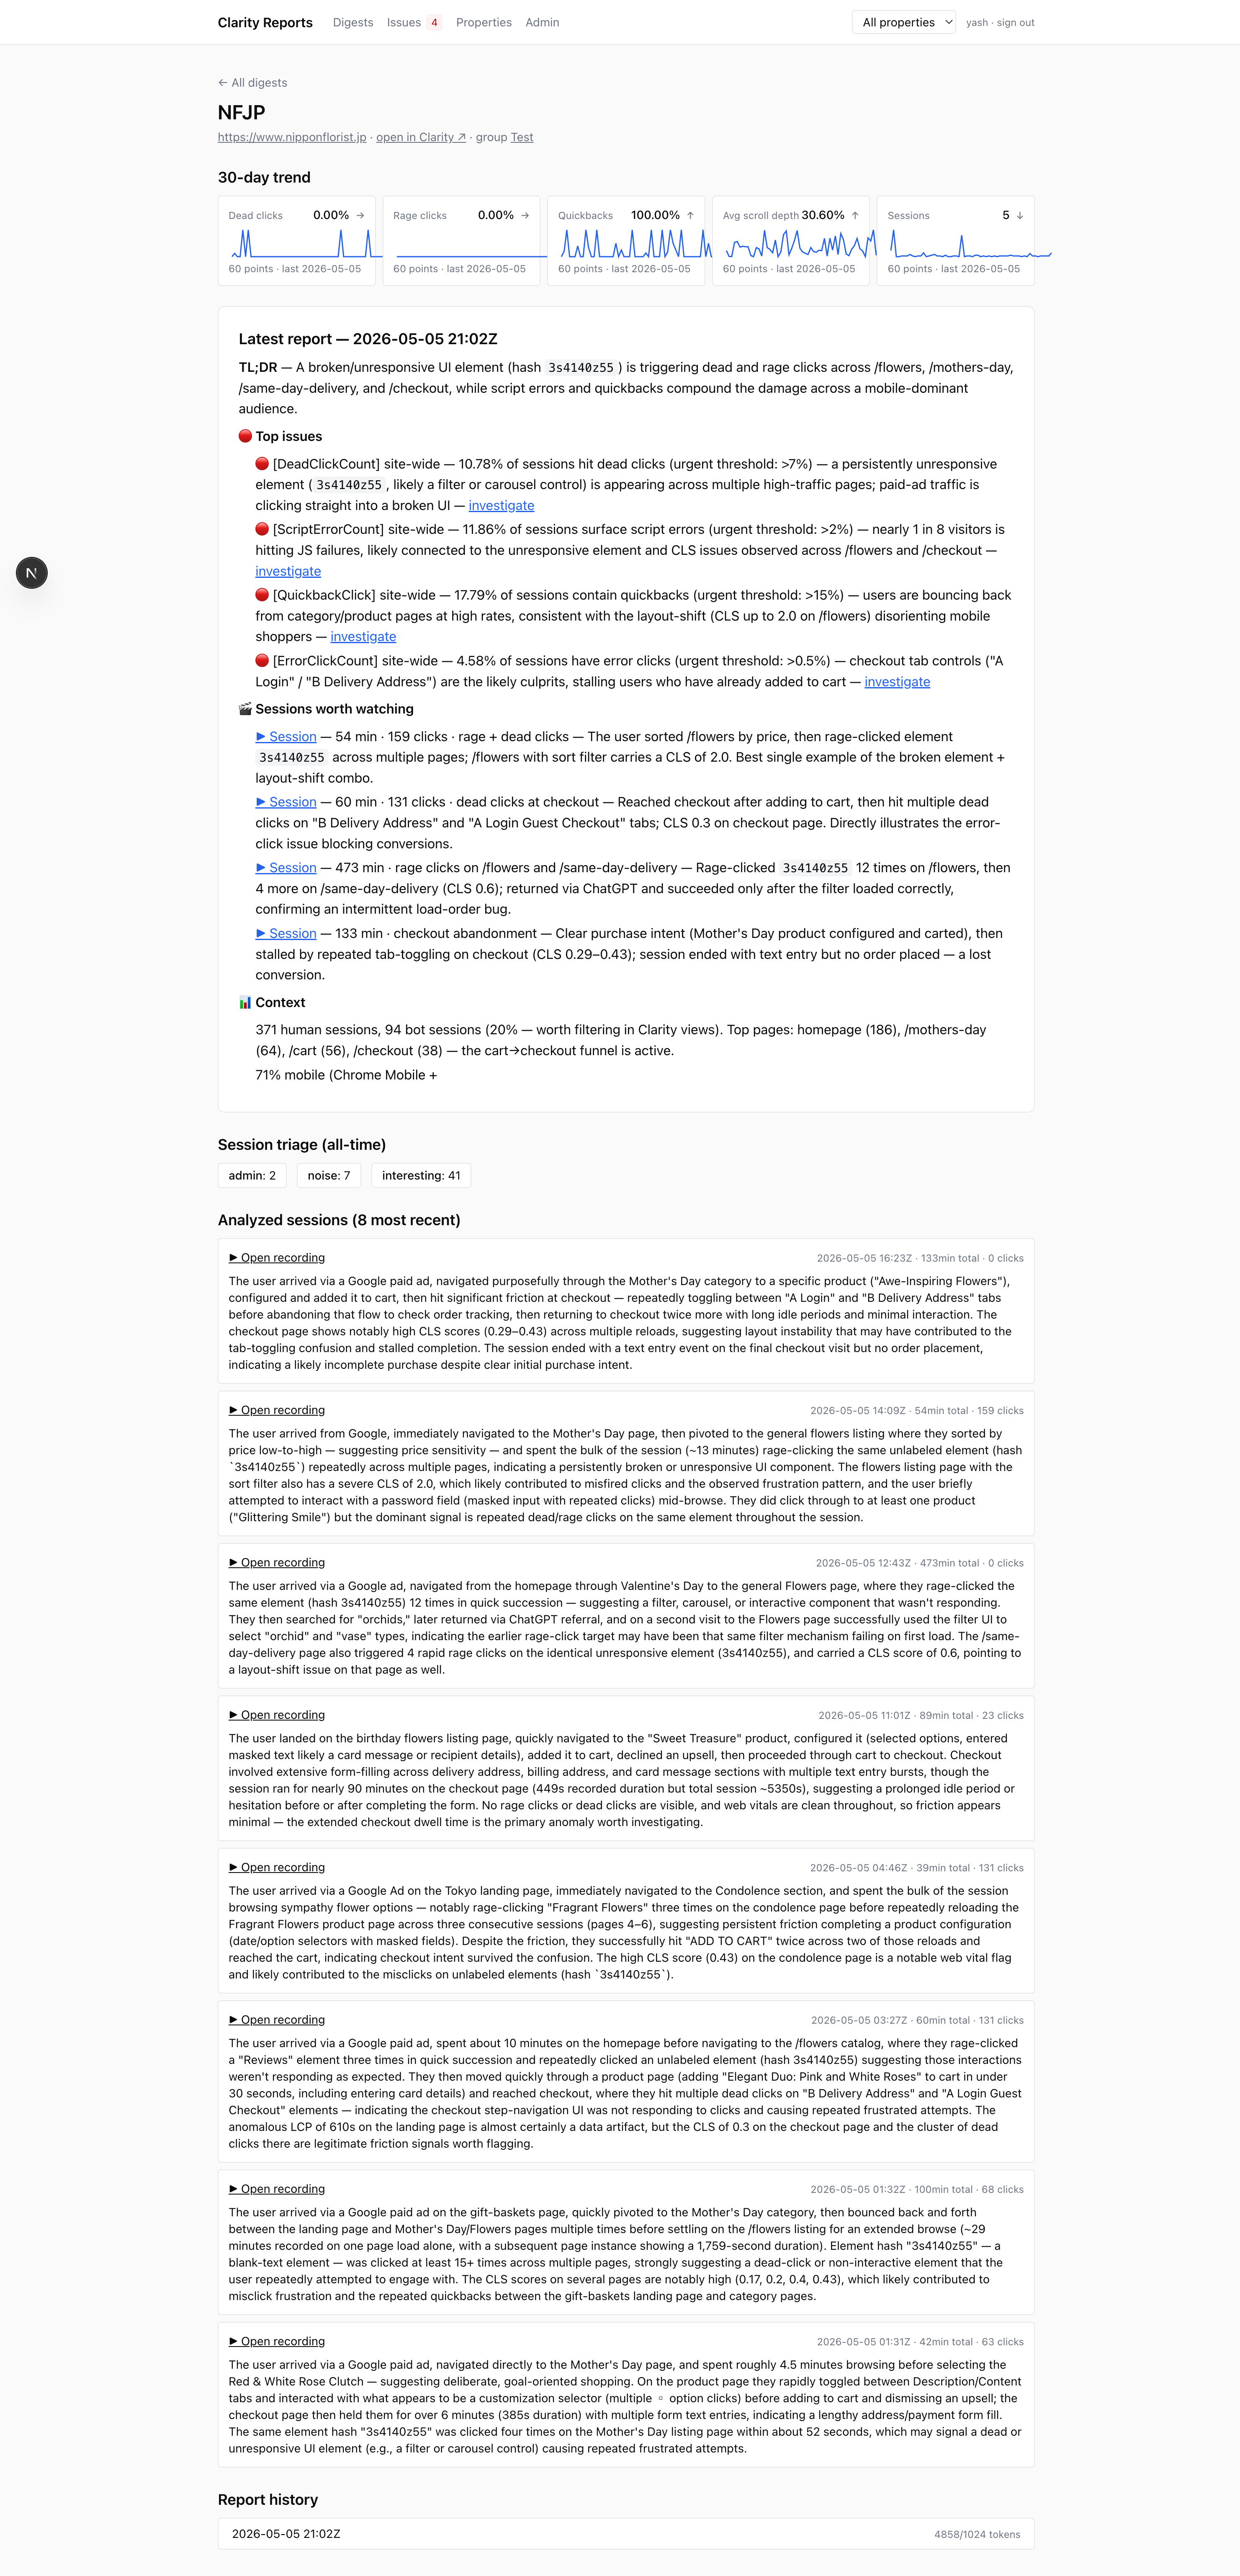
30-day trend sparklines
Five small charts showing how each key metric has moved over the last 30 days. Each one shows the latest value, an arrow (↑ ↓ →) indicating direction, and a sparkline. The first 7-ish days will look sparse — they fill in as more daily runs accumulate.
- Dead clicks % — how often visitors clicked things that didn't respond.
- Rage clicks % — how often they got frustrated and clicked the same spot repeatedly.
- Quickbacks % — how often someone hit the back button right after landing.
- Avg scroll depth — how far down the page the average visitor read.
- Sessions — total visitor count.
Session triage
Every day the system fetches the longest session recordings for the property and classifies each one before deciding whether to ask Claude for a summary. The Session triage counts on the property page show how that played out:
- interesting — substantive engagement (long active time + clicks, OR a rage-click pattern, OR multi-page browsing). These get Claude summaries.
- idle — long total time but almost no activity. Tab left open. Filtered out.
- admin — internal staff (URLs match
/admin/). Filtered out. - noise — too short or no real signal. Filtered out.
Roughly 80% of recordings are filtered out as noise/idle/admin. Only the interesting ones reach Claude — that keeps cost reasonable and the analysis useful.
Watching session recordings
Session recordings are screen-replays of real user visits, hosted by Microsoft Clarity. You can open them from three places in this dashboard — pick whichever fits the moment:
Clicking ▶ Open recording opens the Microsoft Clarity player in a new tab — you'll see the user's full session: cursor movement, clicks, scrolls, page navigations.
Admin (admins only)
/admin/properties — bulk-import properties from a CSV. Required columns: groupName, propertyName, clarityProjectId, websiteUrl, clarityApiToken. Optional: emailTo, slackChannel, scheduleCron. Preview first, commit when satisfied. Re-uploading the same project ID updates rather than duplicates.
/admin/users — add team members, reset passwords, change roles, disable accounts. Only admins see the Admin link in the header.
Property scope (header dropdown)
The dropdown next to your name scopes the entire UI to a single website. Pick “NFJP” and Triage, Digests, Issues, the stats strip — everything — shows only NFJP data. Pick “All properties” to reset.
A few status terms
| Status | Meaning |
|---|---|
| open | New / untriaged. Default state when an issue is first extracted. |
| fixing | You hit Fix — the team is actively working on this. |
| snoozed | Hidden from triage until a date you chose. |
| resolved | Fixed. Has a resolution note + who closed it (you, a teammate, or “auto” via similarity). |
| won't fix | Decided not to address. Off the queue, kept for audit. |
FAQ
- Why is my Triage page empty?
- Either the daily run hasn't fired yet (it's 4:30am IST), every issue is resolved, or your scope dropdown is set to a property that has no open issues.
- Why does the digest say a site failed?
- Most common cause: that property hit Microsoft Clarity's 10-call/day limit (auto-resets in 24h), or the Anthropic credit balance is empty. The other sites in the same group still produce reports.
- An issue I resolved keeps coming back. Why?
- It shouldn't. Resolved issues stay resolved even if the metric is re-flagged tomorrow. If you see a brand-new issue with the same metric, the scope (page) is probably different — Claude found the problem on a different URL.
- How much does this cost?
- ~$0.05 per site per daily run on Sonnet 4.6 with prompt caching. The MTD cost tile on Triage shows your running total.